
Real estate fraud hit $32.4M in Q1 2026. Here's what the data shows.
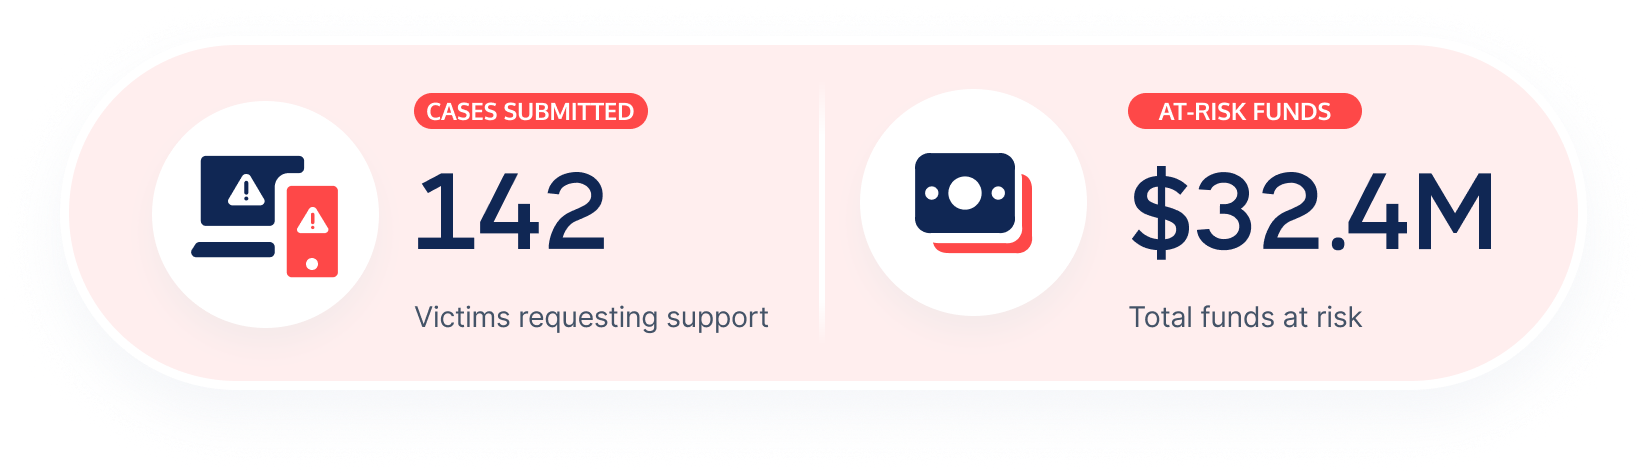
142 fraud cases. $32.4M at risk. One quarter. Here's what the numbers are telling us — and what to watch heading into Q2.
Share article:


Michelle Artreche
3 minutes
Fraud Recovery
Apr 29, 2026
Apr 29, 2026
In Q1 2026 alone, CertifID's Fraud Recovery Services team processed 142 cases totaling $32.4M in at-risk funds. The cases span fraud types, geographies, and transaction stages.
But the patterns that emerge tell a clear story about where the industry needs to pay attention right now.
Here's a breakdown of the key findings from the Q1 2026 FRS Report.
Buyer cash to close is still the #1 target
Of all accepted cases in Q1, 40% targeted buyer cash to close. That makes it the most common fraud type this quarter.
The average attempted loss per buyer cash to close case was $246,968.
Buyer cash to close is the key moment in a transaction when the most money moves quickly. Buyers are sending funds they've spent months saving. The timeline is tight, and the urgency is high.
The good news: Buyer cash to close cases saw $1.5M in recovered funds against $5.2M at risk. That's the highest recovery total of any fraud type this quarter. Speed of reporting and immediate intervention made all the difference.
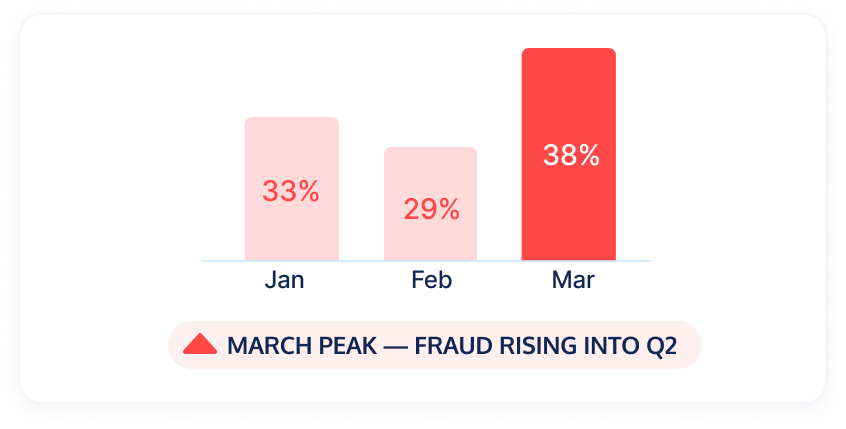
Fraud volume peaked in March
Case volume built steadily through Q1. January accounted for 33% of the quarter's accepted cases. February dipped slightly to 29%. March closed as the quarter's peak at 38%, a 33% jump over February. That kind of acceleration heading into the spring buying season is worth paying attention to.
More transactions mean more opportunities for bad actors to intercept. Q2 is already underway, and transaction activity is rising. The pattern from Q1 is worth keeping in front of your team.

One more number worth sitting with is that the average reported loss per accepted case across all fraud types was $623K. That alone makes the case for having verified wire procedures in place before every single closing.
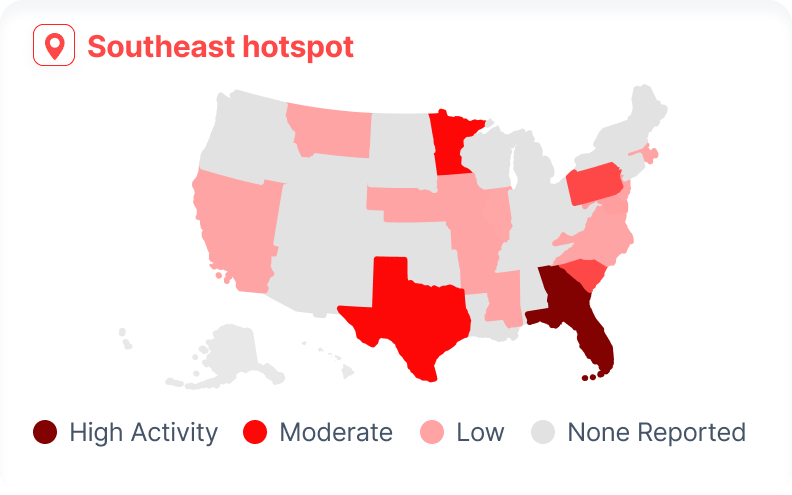
The Southeast remains the hottest fraud geography in the country
Florida, Georgia, and Pennsylvania led all states in Q1 FRS submissions. The Southeast corridor continues to be the most concentrated real estate fraud region in the country. Texas, Minnesota, Maryland, and Missouri also showed notable activity this quarter.
If your transactions are concentrated in these markets, this data speaks directly to your clients. High transaction volume, combined with competitive buying conditions, creates more opportunities for fraud. The geographic signal here is consistent with what we've seen across broader industry trends.
What this means for your closings
If you've made it this far, you already know the stakes. Here's the practical part.
The Q1 numbers reinforce a few things that should already be part of every transaction workflow. Verified wire instructions matter. Calling back on a known number before any wire is sent matters. And having a fraud recovery process in place before you need it matters most of all.
CertifID's Fraud Recovery Services exists specifically for the moments after fraud is detected, when the window to recover funds is measured in hours, not days. That $1.5M recovered for buyer cash to close victims in Q1 didn't happen by accident. It happened because someone acted fast.
Real estate fraud is not going away. But the data gives us a clearer picture of where it's happening, how it's happening, and what recovery looks like when the right tools are in place. That's a starting point.
The complete infographic breaks down every fraud type, the full geographic distribution, monthly volume trends, and the quarter's standout recovery signals, all in one place.
FAQ
Content Marketer
Michelle has spent her career in B2B SaaS startups leading content marketing, strategy, and social media efforts that help teams grow and audiences stay informed. At CertifID, she applies that expertise to help title and real estate professionals understand fraud risks and stay ahead of emerging threats.
In Q1 2026 alone, CertifID's Fraud Recovery Services team processed 142 cases totaling $32.4M in at-risk funds. The cases span fraud types, geographies, and transaction stages.
But the patterns that emerge tell a clear story about where the industry needs to pay attention right now.
Here's a breakdown of the key findings from the Q1 2026 FRS Report.
Buyer cash to close is still the #1 target
Of all accepted cases in Q1, 40% targeted buyer cash to close. That makes it the most common fraud type this quarter.
The average attempted loss per buyer cash to close case was $246,968.
Buyer cash to close is the key moment in a transaction when the most money moves quickly. Buyers are sending funds they've spent months saving. The timeline is tight, and the urgency is high.
The good news: Buyer cash to close cases saw $1.5M in recovered funds against $5.2M at risk. That's the highest recovery total of any fraud type this quarter. Speed of reporting and immediate intervention made all the difference.
Fraud volume peaked in March
Case volume built steadily through Q1. January accounted for 33% of the quarter's accepted cases. February dipped slightly to 29%. March closed as the quarter's peak at 38%, a 33% jump over February. That kind of acceleration heading into the spring buying season is worth paying attention to.
More transactions mean more opportunities for bad actors to intercept. Q2 is already underway, and transaction activity is rising. The pattern from Q1 is worth keeping in front of your team.
One more number worth sitting with is that the average reported loss per accepted case across all fraud types was $623K. That alone makes the case for having verified wire procedures in place before every single closing.
The Southeast remains the hottest fraud geography in the country
Florida, Georgia, and Pennsylvania led all states in Q1 FRS submissions. The Southeast corridor continues to be the most concentrated real estate fraud region in the country. Texas, Minnesota, Maryland, and Missouri also showed notable activity this quarter.
If your transactions are concentrated in these markets, this data speaks directly to your clients. High transaction volume, combined with competitive buying conditions, creates more opportunities for fraud. The geographic signal here is consistent with what we've seen across broader industry trends.
What this means for your closings
If you've made it this far, you already know the stakes. Here's the practical part.
The Q1 numbers reinforce a few things that should already be part of every transaction workflow. Verified wire instructions matter. Calling back on a known number before any wire is sent matters. And having a fraud recovery process in place before you need it matters most of all.
CertifID's Fraud Recovery Services exists specifically for the moments after fraud is detected, when the window to recover funds is measured in hours, not days. That $1.5M recovered for buyer cash to close victims in Q1 didn't happen by accident. It happened because someone acted fast.
Real estate fraud is not going away. But the data gives us a clearer picture of where it's happening, how it's happening, and what recovery looks like when the right tools are in place. That's a starting point.
The complete infographic breaks down every fraud type, the full geographic distribution, monthly volume trends, and the quarter's standout recovery signals, all in one place.
Content Marketer
Michelle has spent her career in B2B SaaS startups leading content marketing, strategy, and social media efforts that help teams grow and audiences stay informed. At CertifID, she applies that expertise to help title and real estate professionals understand fraud risks and stay ahead of emerging threats.
Sign up for The Wire to join the conversation.


.png)

Austin
3601 South Congress Ave.
Ste D200, Austin, Texas 78704
Grand Rapids
124 Fulton Street E
Grand Rapids, MI 49503
