


Where real estate fraud is moving: Q2 2026 FRS data
$22M at risk. 183 cases. One quarter. The fraud mix shifted in Q2, and the data points to a fraud type that almost no one is watching closely enough.
Share article:


Michelle Artreche
3 minutes
Fraud Recovery
Jul 7, 2026
Jul 20, 2026
In Q1, buyer cash to close was the dominant story. 40% of all cases, the largest share of at-risk funds, and the most direct target in the closing.
Q2 data is more complicated.
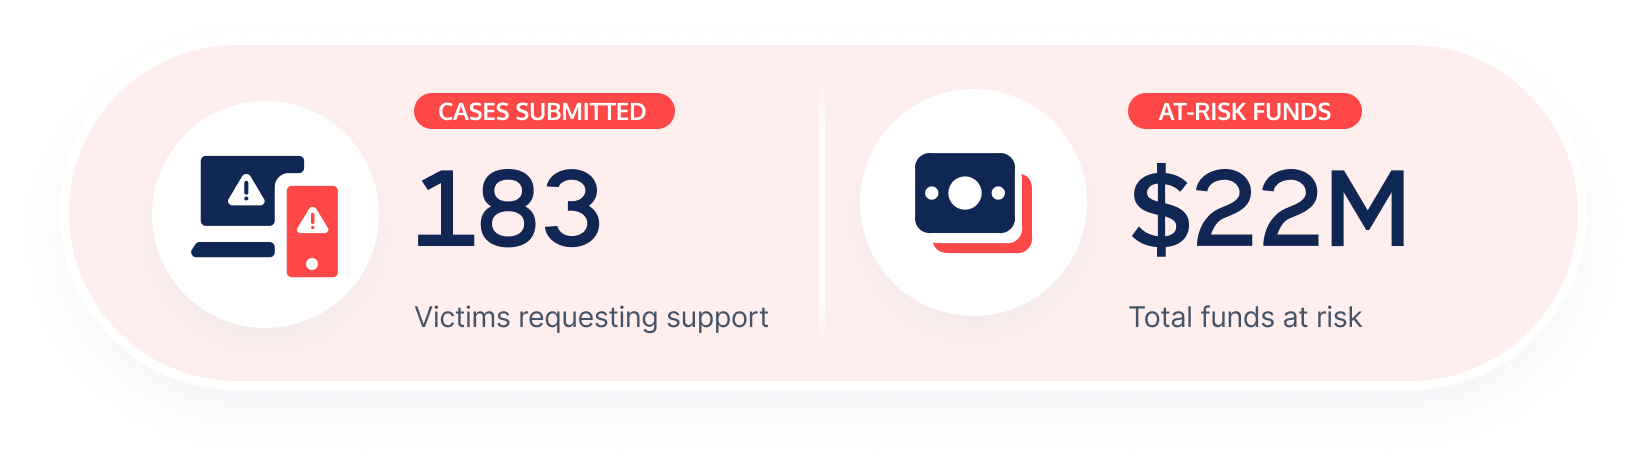
CertifID's Fraud Recovery Services (FRS) team tracked $22M in at-risk funds across 183 Q2 submissions. The number of submissions is up 28.9% from Q1. But the more important shift is what happened inside the fraud-type mix.
Here’s a breakdown of the key findings from the Q2 2026 FRS Report.
Seller net proceeds fraud is Q2’s standout shift
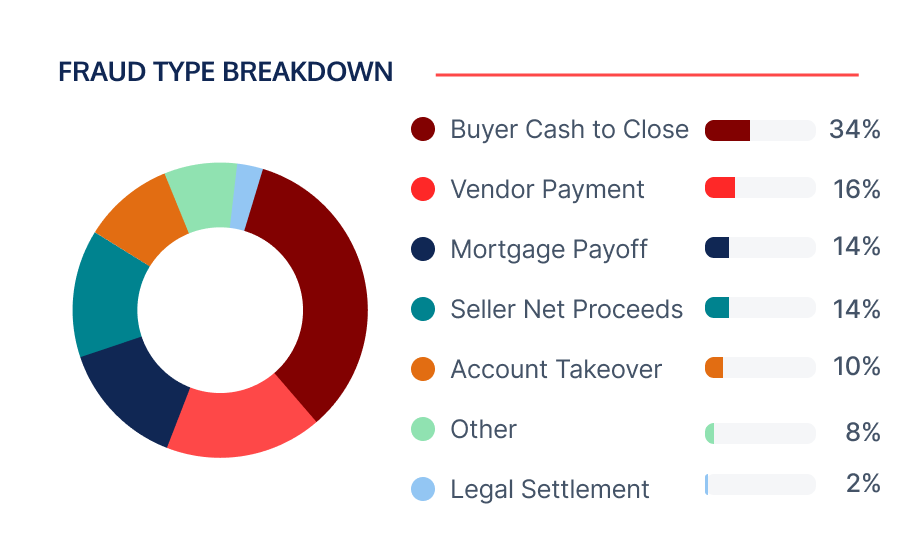
In Q1, seller net proceeds fraud made up 4% of all FRS submissions. In Q2, that share climbed to 14%.
Seller net proceeds fraud targets the funds owed to the seller at closing. Bad actors intercept or redirect those disbursements, often by compromising seller-side communication before or during the closing. Because the focus in most closing workflows is on protecting buyer wire instructions, seller disbursements can be a less-scrutinized point of exposure.
Seller net proceeds is now tied with mortgage payoff as the second most common fraud type in Q2. That shift is worth paying attention to.
Buyer cash to close fraud still leads, but its share is shrinking.
Buyer cash to close remained the most common fraud type in Q2 at 35% of all submissions, down from 40% in Q1.
The decline in share does not mean the risk is lower. Simply said, with overall volume up 28.9%, more buyer cash to close cases were submitted in Q2 than Q1. It means fraud is spreading across more transaction types, and buyer cash to close is no longer as concentrated as it was.
Mortgage payoff fraud dropped from 23% of submissions in Q1 to 14% in Q2, and account takeover fell from 21% to 10%. The types that defined Q1 are giving way to a broader distribution of fraud across the closing.
May peak, but fraud stayed active through June
May accounted for 47% of Q2 submissions, compared to 26% in April and 27% in June.
Unlike Q1, which saw a volume spike in March and then a drop, Q2 did not follow the same taper pattern. May was the peak of spring closing season, but June remained nearly as active as April. The distribution was more sustained than a single-month spike.
Fraud volume tracks closely with closing volume. Closing professionals heading into a busy summer market should expect case volume to reflect it.
The geographic footprint expanded in Q2
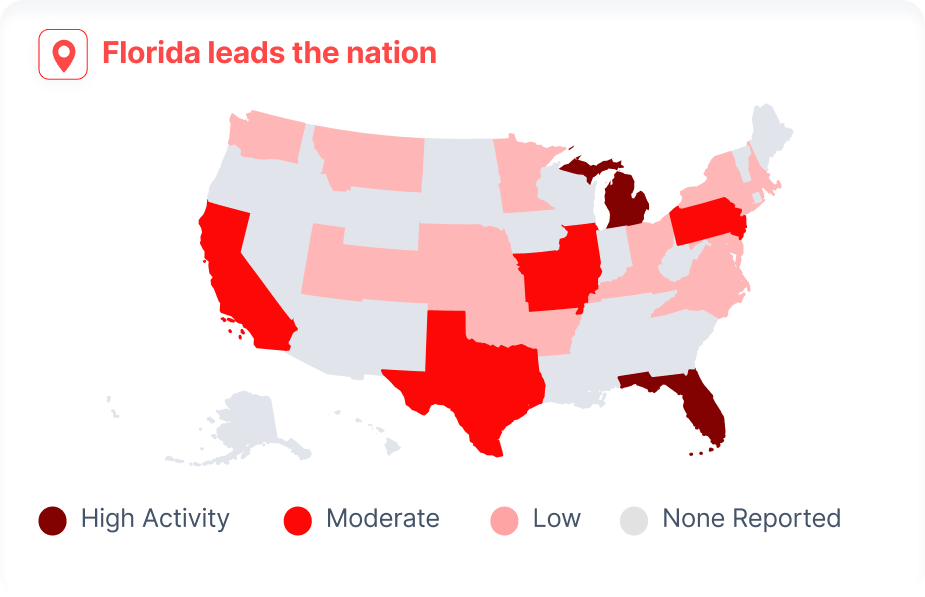
Florida held the top position for Q2 FRS submissions, consistent with what we saw in Q1. Georgia and North Carolina were also among the most active states.
The notable Q2 development is what happened in the Midwest. Michigan and Illinois both appeared with elevated case counts, representing a meaningful shift from the Southeast-heavy distribution seen in Q1. Ohio, Pennsylvania, and Virginia also showed up in the data.
Fraud follows real estate transaction volume, and the Midwest is an active market heading into summer. The Q2 data suggests that activity is showing up in the fraud numbers, too.
What this means for your closings
The Q2 data adds detail to a picture that was already forming.
- Buyer cash to close fraud is still the most common target, but its share is shrinking.
- Seller net proceeds fraud is now the fastest-growing fraud type this quarter.
- The geography expanded beyond the Southeast, too.
The common thread across every fraud type in the data is timing. Seller funds, buyer wires, payoff instructions, and account credentials are all targeted at the same point in the closing, the moment money is about to move. Validating instructions immediately before disbursement, and across every transaction type, is the step that changes outcomes.
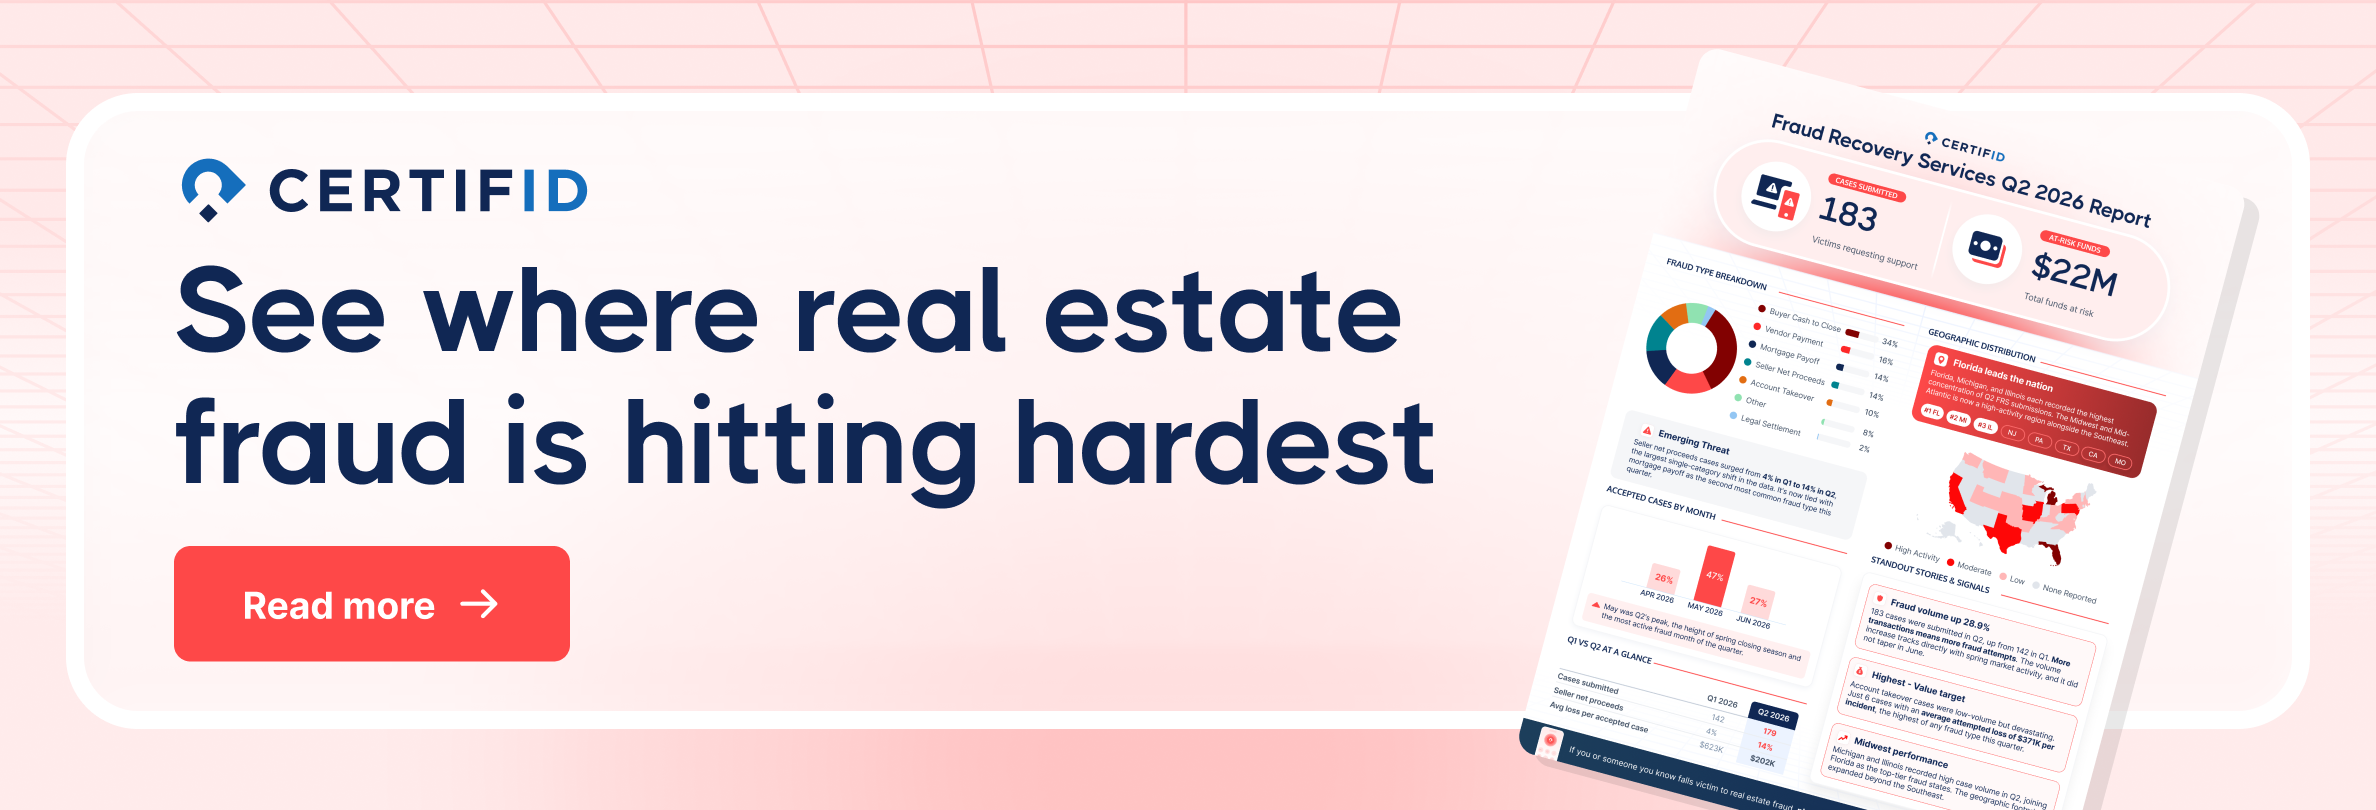
The Q2 data shows where the risk is concentrating now. The complete infographic breaks down every fraud type, the full geographic distribution, monthly volume trends, and the quarter’s standout recovery signals, all in one place.
Fraud Recovery Services exists specifically for the moments after fraud is detected, when the window to recover funds is measured in hours, not days. If you believe you have become a victim of wire fraud, contact our hotline.
FAQ

Content Marketer

Michelle has spent her career in B2B SaaS startups leading content marketing, strategy, and social media efforts that help teams grow and audiences stay informed. At CertifID, she applies that expertise to help title and real estate professionals understand fraud risks and stay ahead of emerging threats.
In Q1, buyer cash to close was the dominant story. 40% of all cases, the largest share of at-risk funds, and the most direct target in the closing.
Q2 data is more complicated.
CertifID's Fraud Recovery Services (FRS) team tracked $22M in at-risk funds across 183 Q2 submissions. The number of submissions is up 28.9% from Q1. But the more important shift is what happened inside the fraud-type mix.
Here’s a breakdown of the key findings from the Q2 2026 FRS Report.
Seller net proceeds fraud is Q2’s standout shift
In Q1, seller net proceeds fraud made up 4% of all FRS submissions. In Q2, that share climbed to 14%.
Seller net proceeds fraud targets the funds owed to the seller at closing. Bad actors intercept or redirect those disbursements, often by compromising seller-side communication before or during the closing. Because the focus in most closing workflows is on protecting buyer wire instructions, seller disbursements can be a less-scrutinized point of exposure.
Seller net proceeds is now tied with mortgage payoff as the second most common fraud type in Q2. That shift is worth paying attention to.
Buyer cash to close fraud still leads, but its share is shrinking.
Buyer cash to close remained the most common fraud type in Q2 at 35% of all submissions, down from 40% in Q1.
The decline in share does not mean the risk is lower. Simply said, with overall volume up 28.9%, more buyer cash to close cases were submitted in Q2 than Q1. It means fraud is spreading across more transaction types, and buyer cash to close is no longer as concentrated as it was.
Mortgage payoff fraud dropped from 23% of submissions in Q1 to 14% in Q2, and account takeover fell from 21% to 10%. The types that defined Q1 are giving way to a broader distribution of fraud across the closing.
May peak, but fraud stayed active through June
May accounted for 47% of Q2 submissions, compared to 26% in April and 27% in June.
Unlike Q1, which saw a volume spike in March and then a drop, Q2 did not follow the same taper pattern. May was the peak of spring closing season, but June remained nearly as active as April. The distribution was more sustained than a single-month spike.
Fraud volume tracks closely with closing volume. Closing professionals heading into a busy summer market should expect case volume to reflect it.
The geographic footprint expanded in Q2
Florida held the top position for Q2 FRS submissions, consistent with what we saw in Q1. Georgia and North Carolina were also among the most active states.
The notable Q2 development is what happened in the Midwest. Michigan and Illinois both appeared with elevated case counts, representing a meaningful shift from the Southeast-heavy distribution seen in Q1. Ohio, Pennsylvania, and Virginia also showed up in the data.
Fraud follows real estate transaction volume, and the Midwest is an active market heading into summer. The Q2 data suggests that activity is showing up in the fraud numbers, too.
What this means for your closings
The Q2 data adds detail to a picture that was already forming.
- Buyer cash to close fraud is still the most common target, but its share is shrinking.
- Seller net proceeds fraud is now the fastest-growing fraud type this quarter.
- The geography expanded beyond the Southeast, too.
The common thread across every fraud type in the data is timing. Seller funds, buyer wires, payoff instructions, and account credentials are all targeted at the same point in the closing, the moment money is about to move. Validating instructions immediately before disbursement, and across every transaction type, is the step that changes outcomes.
The Q2 data shows where the risk is concentrating now. The complete infographic breaks down every fraud type, the full geographic distribution, monthly volume trends, and the quarter’s standout recovery signals, all in one place.
Fraud Recovery Services exists specifically for the moments after fraud is detected, when the window to recover funds is measured in hours, not days. If you believe you have become a victim of wire fraud, contact our hotline.
Content Marketer
Michelle has spent her career in B2B SaaS startups leading content marketing, strategy, and social media efforts that help teams grow and audiences stay informed. At CertifID, she applies that expertise to help title and real estate professionals understand fraud risks and stay ahead of emerging threats.
Sign up for The Wire to join the conversation.







Austin
3601 South Congress Ave.
Ste D200, Austin, Texas 78704

Grand Rapids
124 Fulton Street E
Grand Rapids, MI 49503

